
Sienna Ultimate ERP
The EMS Sienna Ultimate System is a multichannel EEG / EMG / ERP acquisition and analysis system for clinical and research use. The amplifier is designed to record signals from 0.1 to 1000 Hz. With the Sienna Ultimate System you can acquire online EEG simultaneously with Evoked Potentials and EMG in split screen form. Each channel can be modified for unipolar or bipolar recording. Up to 256 different trigger events can be shown online and offline in different colours for P300 or CNV tests. On one screen you can show the raw data, FFT analysis and Mapping.
Features
- ERP / EP acquisition from 32 to 192 channels
- Online and offline averaging
- Up to 4000 Hz sampling rate per channel
- Filters from 0.1 - 1000Hz
- Offline filtering: individual control for each waveform
- 8 bit Trigger input
- Multiple export function
- TCP/IP LAN interface
- Automatic and manual Artefact rejection with selectable amplitude or window
- Baseline correction for the whole length or user defined window
- Full bipolar or unipolar recording
Brain Electrical Source Analysis (BESA) - Data review and processing
The main BESA window provides many tools for reviewing and processing of your EEG or MEG data. Raw data are directly read using readers implemented for many EEG and MEG file formats. Data processing steps include digital filtering, artifact detection and correction, computation of correlation and spectral analysis. All these steps can be performed easily with a few mouse clicks or using user-defined batch scripts. A variety of different display options allows for convenient review of your data.
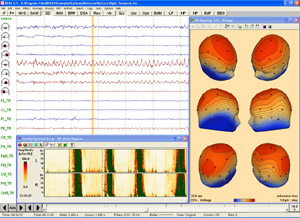
The figure shows the onset of an epileptic seizure, analyzed with 3D whole-head maps and a hemispheric comparison of density spectral arrays (DSA).
Source montages
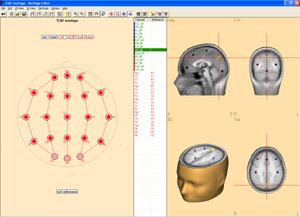
The BESA montage editor allows for graphical editing of user montages for convenient data review. The original recording can be easily rereferenced and interpolated to virtual montages with standardized electrode locations. Source montages transform the surface EEG or MEG into brain source activity. They can be derived from multiple dipole or regional source models. PCA components and eye artifacts can be displayed as additional channels. BESA offers 3D whole-head maps for the visualization of EEG/MEG data, CSD, and FFT power, amplitude and phase.
Figure: Montage editor providing a graphical display of a user defined montage combining bipolar EEG and brain source channels.
ERP analysis
The ERP module module assists in extracting event-related potentials or fields from your raw data. It provides an easy-to use interactive tool for designing your own scripted paradigms with predefined trigger definitions, conditions and settings for averaging. Data Files can be scanned automatically for artifacts, and bad channels and samples can be easily identified and excluded using an advanced 2D selection tool. A variety of displays is at hand to view the event-related signals, including 3D whole head maps and a top view display.
Figure: Top view of two averaged conditions in a P3 paradigm: 3D whole-head map, channel overplot and additional channel display.
Source analysis and imaging
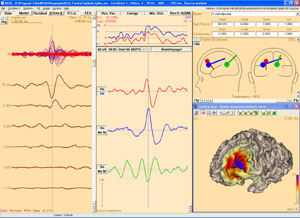
BESA has a highly interactive and easy-to-use window for source analysis. All relevant information is available at one glance including data, PCA, source waveforms and source localization in 3D head schemes or standardized MRI. You can choose among a variety of head models and state-of-the-art source modeling techniques including discrete source analysis, LORETA, minimum norm, beamforming, sLORETA, sSLOFO and others. 2D and 3D source imaging can be performed with projection onto a standardized MRI.
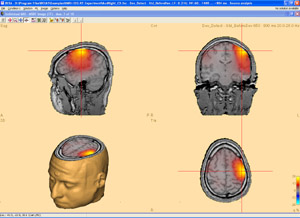
Figure: Discrete multiple source analysis and individual minimum norm image of an epileptic spike generated around a frontal brain lesion.
Source coherence and time-frequency analysis
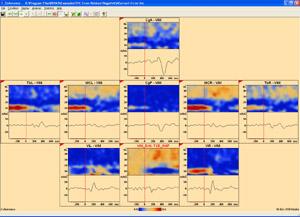
Source coherence analysis reveals the functional connectivity between brain regions. This is achieved by transforming the surface signals into brain activity using brain source montages derived from multiple source models. The new Source Coherence Module provides an extremely fast and user-friendly implementation of time-frequency analysis based on complex demodulation. Users can create event-related time-frequency displays of power, amplitude, or event-related (de)synchronization and coherence for the current montage using brain sources or surface channels. Induced and evoked activities can be separated.
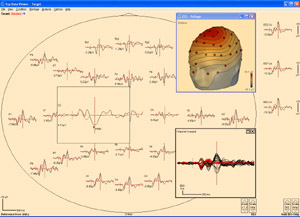
Figure: Time-frequency display of source coherence between nine brain regions of a user-defined source montage in an ERN experiment.
For more information about BESA please contact: www.besa.de